Basic arithmetic/calculus.
In the series: Note 3.
Subject: Polynomials & quadratic functions


Date : 16 Februari, 2016
Version: 0.5
By: Albert van der Sel
Doc. Number: Note 3.
For who: for beginners.
Remark: Please refresh the page to see any updates.
Status: Ready.


This note is especially for beginners.

Maybe you need to pick up "some" basic "mathematics" rather quickly.
So really..., my emphasis is on "rather quickly".

So, I am really not sure of it, but I hope that this note can be of use.
Ofcourse, I hope you like my "style" and try the note anyway.


This note: Note 3: Polynomials & quadratic functions.

Each note in this series, is build "on top" of the preceding ones. If you are not familiar with, for example,
"linear equations" in the form of "y=ax+b", then it's highly recommended to read Note 2 first.


Contents:

1. Introduction quadratic equations y=ax2 + bx + c.
2. How "a", "b" and "c" determine the shape and location of y=ax2 + bx + c.
3. Quickly finding the "top" (or max/min) of the parabola.
4. Intersections of a parabola with the X-axis and Y-axis.
5. Intersection of a line with a parabola.
6. Linear and Quadratic Inequalities.
7. Quadratic functions compared to relations.
8. A few words on Higher order polynomials.


1. Introduction quadratic equations y=ax2 + bx + c.

- Again a few words on Linear equations first:

In physics, and other sciences, observations and experiments have shown us that linear relations in the form of "y=ax+b"
are very common to use to describe (and explain) those observations.

As a simple example: If a car drives 50 mph, then in one hour, it has travelled 50 miles. In 2 hours
it has travelled 100 miles. In 3 hours time, it has travelled 150 miles etc..
This is a linear relation between "distance" and "time".

Usually, in physics, the distance covered in a certain time is abreviated by "S" (or "d"),
the time involved is usually abreviated by "t", and the (constant) speed is usually abreviated by "v".

It can be shown that "S = v x t", or "S = vt", since usually the multiplication operator (symbol "x") is left out.

You can plot this relation in a Coordinate system, like we have seen in Note 2, and in such Coordinate system,
if you would replace "y" with "S", and "x" with "t", you get a common line again.

As another simple example of a linear relation: if you earn 10 bucks per hour, and you work 5 hours, then you have
earned 50 bucks, if you have worked for 10 hours, you have 100 bucks etc.. etc..
The relation between "amount earned" and "hours worked" is linear too.

You can always represent them by "lines" in a (2 dimensional) Coordinate system.

- Quadratic equations:

In this note, we will especially take a look at "quadratic" functions. Also, some attention will go to
higher order functions and relations as well.

So, what are we talking about? The general form of a quadratic equation is:

y=ax2 + bx + c

where a, b, and c, are some constant numbers. Each a, b, and c, defines another quadratic equation,
just like every a and b in a linear eqation (y=ax+b), determines what sort of line we are dealing with.
br> In a quadratic equation, the constants "b" and "c" can optionally be 0, since the "most" defining term
in the equation is the x2 part (as you will see later on).

The associated curves in a (2 dimensional) Coordinate system, are parabola.

- Example: A simple quadratic equation: y=ax2

Let's investigate the simplest form of a quadratic equation: y=ax2.
Let's take a=1, so we have y=x2.

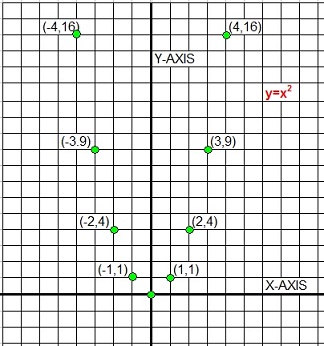
As usual, we take a couple of "x-values", and see what the corresponding "y-values" are. See table 1.

Table 1: calculate "y" for a number of x values.

value of x: value of y:
x= -4, then y= 16 (because -4 x -4 = 16)
x= -3, then y= 9 (because -3 x -3 = 9)
x= -2, then y= 4 (because -2 x -2 = 4)
x= -1, then y= 1 (because -1 x -1 = 1)
x= 0, then y= 0 (because 0 x 0 = 0)
x= 1, then y= 1 (because 1 x 1 = 1
x= 2, then y= 4 (because 2 x 2 = 4
x= 3, then y= 9 (because 3 x 3 = 9
x= 4, then y= 16 (because 4 x 4 = 16)

Let's plot the points now. Take a look at figure 1.

Figure 1. Some points of y=x2.


If you draw a smooth curve connecting the points, you get a parabola.
Note that such a curve (near x=0) has "a slow start", but then starts "climbing fast".
For example, if x=100, then y=10000. You can calculate that fact by yourself.

Note:
In physics (and other sciences), parabolic curves are very common. I will explain them later.
For example, a parabolic antenna (or reciever), which can focus radio- or light waves.
Or, if you fire a bullet with a certain angle, the trajectory will be a near perfect parabola
on the moon, or a litlle less perfect parabola on Earth (due to friction and other interactions).
With the latter example, that parabola will be "upside down" ofcourse, compared to figure 1.

Exercise 1: I would like you to Google on parabola images, for a couple of minutes or so.

- Adding the constant "c", or, the equation y=x2 + c:

Something interesting happens, if we add the constant "c" to y=x2.
Remember, "c" can be a positive number, or a negative number. So, we can have as example equations:

y=x2 + 3

or, for example

y=x2 - 3

Can you see what happens?

If we look at figure 1, and we now think of "y=x2 + 3", it's just as if the whole of figure 1
is lifted upwards, by 3, over all x values.
You can also see that from table 1. Just add 3 to all "y-values" in that table.

If we now think of "y=x2 - 3", it's just as if the whole of figure 1 drops down by 3,
over all x values. You can also see that from table 1. Just substract 3 from all "y-values" in that table.

Exercise 2: Can you analyze "y=x2 + 3", that is, create a table like table 1, and then plot the points?

2. How "a", "b" and "c" determine the shape and location of y=ax2 + bx + c

- The effect of "a" as a positive number, or negative number:

The "nose" of a parabola is called the "vertex". In figure 1, it's the "lowest" point, at (0,0).
With the example parabola "y=x2" the "nose" is "pointed" downwards.

If we would have analyzed the function "y=-x2", then we would have seen that
that curve, would be the mirror of "y=x2" with respect to the x-axis.

So, the "vertex" (the nose of the parabola) would be pointed upward with it's highest point in (0,0).
If you do not believe this, you only need to invert (make negative) all values of y in table 1.

So, what I want to achieve here, is that you immediately will reckognize that:

y=ax2 + bx + c has it's "nose down" if "a" is a positive number.
y=ax2 + bx + c has it's "nose up" if a is a negative number.

The coefficient "a" determines also the "steepness" of a parabola, which we will see a bit later on.

- The effect of "c", as a positive number, or negative number:

In the equation "y=ax2 + bx + c", the number "c" is just a constant, and possibly even "0".
It's interesting to see the effect of "c", if it takes different values, while "a" and "b" stays the same.

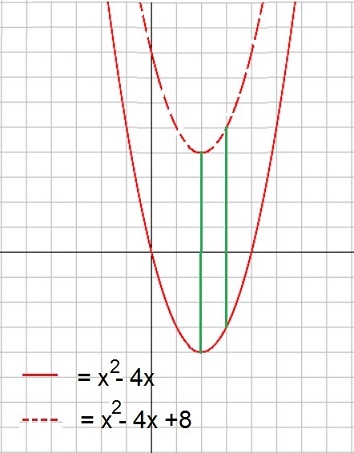
So, suppose we have the parabola:

y= x2 - 4x

and

y= x2 - 4x + 8

So, in the first equation, c=0, and in the second equation, c=8.

If you add a number "c" to y= a2 + bx, then the whole curve "climbs up", vertically,
with the value of "c".

If you substract a number "c" to y= a2 + bx, then the whole curve "sinks", vertically,
with the value of "c".

Take a look at figure 2. The continuous curve is the parabola "y= x2 - 4x"
The "dotted" curve is the parabola "y= x2 - 4x +8"

You can check it by yourself, for the simple parabola "y= x2", and add (for example) 3,
to all values of y in that table. You will see that the whole curve rises up by "3".

It's only logical, since you might have "y={some stuff}" and then "y={some stuff} + 3" for all x on the x-axis.

So, the constant "c" has the effect that a curve rises or drops by "c", depending of the fact you add "c",
or substract "c".

Figure 2. An example of the effect of adding c=8 to a parabola.


- Just some examples of different parabola:

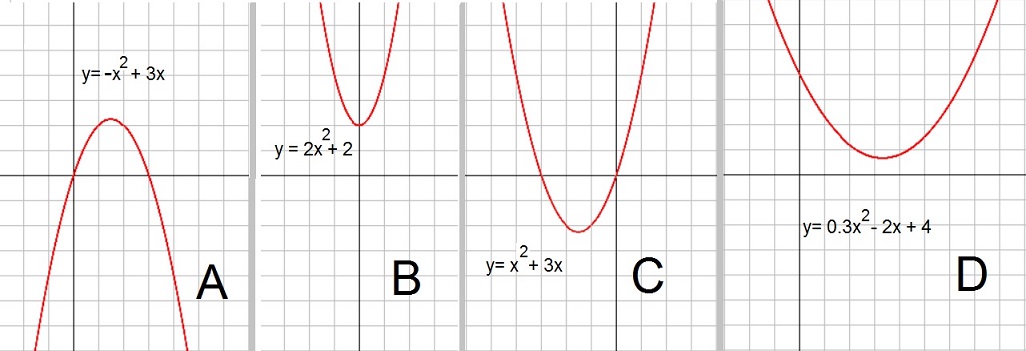
Here are just a few more examples of different parabola. See figure 3.

Figure 3. Some more examples.


Exercise 3: For which of them, is the "a" coefficient negative?

There is much more to say on how the constants a,b, and c determine the shape and location
of a parabola.
Very important points, are the intersections of the parabola with the x-axis and y-axis.
And, finding the "top" (or maximum or minimum) is important too.

3. Quickly finding the "top" (or max/min) of the parabola.

The general "quadratic equation" is:

f(x) = ax2 + bx + c

where a, b, c, are some constant numbers.

You know that a parabola has a "maximum point", or a "minimum point", depending on the sign of "a".
Such a minimum or maximum is also often called the "top".

For example:

f(x) = -x2 -5x + 6 has a minimum.
f(x) = x2 -5x + 6 has a maximum.

In a later note, we will see how we must take "the derivative" of a function, which also
can help in finding the maxima or minima of a function.

For now, however, a simple formula will help us.
This maximum, or minimum point, is a unique point (x, y) which we will call (xM, yM).
For that coordinate, it holds that:

xM = - b
--
2a

Please note the "minus sign" in the formula xM = -(b/2a).

And, once xM is found, you get yM by simply substituting xM into
the equation of that particular parabola.

Example 1:

Suppose we have:

y=x2 - 4x

Then:

xM = -(b/2a) = -(-4/2) = -(-2) = 2.

Then finding yM: yM = 22 - 4 * 2 = 4 - 8 = -4

So the coordinate (xM, yM) is (2, -4). This point is the minimum of that
particular parabola (this parabola has it's nose down).

Example 2:

Suppose we have:

y = -2x2 + 8x +3

Then:

xM = -(b/2a) = -(8/(2*-2)) = = -(8/-4) = -(-2) = 2.

Then finding yM: yM = -2*22 + 8*2 + 3 = -8 + 16 + 3 = 11

So the coordinate (xM, yM) is (2, 11). This point is the maximum of that
particular parabola (this parabola has it's nose up).

4. Intersections of a parabola with the X-axis and Y-axis.

In this section, we are going to do some "calculus".
Our aim is to find out, where a parabola crosses the x- and y- axes.

Well, some do not cross the x-axis. Take a look at figure 3 again. The parabola in examples B and D,
do not cross the x-axis. Their vertex (the lowest point of the "nose") is above the x-axis, and
from that point, they only rise up more and more.

-A parabola in the form "y=ax2 + bx + c" can only have 0, or 1, or 2, intersections with the x-axis.
-A parabola in the form "y=ax2 + bx + c" can only have 1 intersection with the y-axis.

Let's try some calculations.

- Finding the intersection with the y-axis:

This one is really easy. Take a look at figure 3 again.

Key statement: At the intersection with the y-axis, then x is zero!

Note the exclamation mark. Or take a look at figure 1. There you see a nice example of a Coordinate system.
Only at the point where the y-axis is located (vertically), there it holds that x=0.
So, for a general equation, then holds:

y=ax2 + bx + c (for x=0 then:) y = a x 02 + b x 0 + c = c

So, where the parabola crosses the y-axis, is at the point (0,c).

Example:

Find the point where "y=0.3x2 - 2x + 4" crosses the y-axis.

Solution: y= 0.3 x 02 - 2 x 0 +4 = 0 - 0 + 4 = 4

(note: here we use the "x" multiplication symbol again for clarity, while "x" is already filled in: 0)

So the point where that parabola intersects with the y-axis is (0,4).

Example:

Find the point where "y=3x2 + 6x + 5" crosses the y-axis.

Solution: y= 3 x 02 + 6 x 0 + 5 = 0 + 0 + 5 = 5

So the point where that parabola intersects with the y-axis is (0,5).

- Finding the intersection(s) with the x-axis:

Key statement: At the intersection with the x-axis, then y is zero!

Again, such a fact will help us enormously.

I like to split the theory in (1) a special case, and (2) a general solution.
Ofcourse, the general solution covers (1) too, otherwise it would not be a "general solution".

=> Special case: y=ax2 + bx. If y=0, then ax2 + bx = 0

So here the constant c=0.

This is quite quickly to solve. First note that ax2 + bx = x(ax+b)

This is based on the fact that "ab + ac" is the same as "a(b + c)".
Indeed, we know that "5 x (2 + 3)" is the same as "5 x 2 + 5 x 3".

It's the same with "ax2 + bx". We can "factor out" the "x", meaning to rewrite it to x(ax+b)

If y=0, then:

ax2 + bx = x(ax+b)=0.

This means that x=0 or ax+b=0. Thus: x=0 is a solution, and x=-b/a is a solution.

Example:

Find the point where "y= x2 + 3x" crosses the x-axis (where y=0).

Solution: x2 + 3x = 0 Thus: x(x + 3)=0 Thus: x=0 and x + 3=0
For the last one, we may add "-3" to both sides of the "=" symbol, resulting in x=-3.
So, we have found x=0, and x=-3. Combining with the fact that y must be 0, we find the points (0,0) and (-3,0).

=> General solution of: "y=ax2 + bx + c". If y=0, then ax2 + bx + c = 0

Take a look again at figure 1, and figure 3. A parabola in the general form of "y=ax2 + bx + c",
can only have 0, or 1, or 2, intersections with the x-axis (where y=0).

So, we are dealing with ax2 + bx + c = 0

1. General solution 1 - simpler case.
Especially when a, b, and c are "whole" numbers (integers), you can often "expand" (or disolve)
the equation into factors.
Here is an example:

Suppose we have the equation "x2 -6x + 5 = 0"

Then: x2 -6x + 5 = (x-5)(x-1)

It's really not always easy to see. But hopefully, you agree that (x-5)(x-1) = x2 -x -5x + 5 = x2 -6x + 5

It's not much different from ordinary numbers only, for example: (2 + 3)x(4 + 2) = 2x4 + 2x2 + 3x4 +3x2.

Once you have found: x2 -6x + 5 = (x-5)(x-1) = 0, then
(x-5) = 0 or (x-1)=0, thus:
x=5 or x=1

In this case, the points where that parabola intersects with the x-axis, are (5,0) and (1,0).

If you did not fully understood the reasoning above: not to worry at all!
It's still not a general solution that was presented here.

2. General solution 2 - works in all cases.
Next, we will present the true general solution of ax2 + bx + c = 0

It's this. If the parabola crosses the x-axis at two points, called x1 and x2, then:

x1= -b + √(b2 -4ac)
-------------------      
        2a

x2= -b - √(b2 -4ac)
-------------------      
        2a

We can "proof" those formula's, but that will "clutter" this note too much, so I will leave that out.
But for a less formal "proof", see the note below.

Note: Simple way on how to proof them:

But those formula's can be made "less hard to believe". Really. remember the simpler equation "ax2 + bx =0"
where "c" is nul?

I came up with:

"x = 0" as a solution, and
"x = -b/a" as a solution.

Well, in upper 2 formula's, you might like to substitute "c=0", then √(b2 -4ac) = √(b2) = b.

This means that for example x1 = (-b + b)/2a = 0 and x2 = (-b - b)/2a = -2b/2a = -b/a
This is exactly what we found before.

Example of using the general solution:

Suppose we have the equation x2 -6x + 5 = 0 again.

Then using the two formula's above:

x1 = (--6 -√(-62 - 4x1x5)) / 2 = (6 - √(36 - 20)) / 2 = (6 - √(16)) / 2 = (6 - 4) / 2 = 2/2 = 1

x2 = (--6 +√(-62 - 4x1x5)) / 2 = (6 + √(36 - 20)) / 2 = (6 + √(16)) / 2 = (6 + 4) / 2 = 10/2 = 5

If you take a look above, then indeed we found the same intersections (1,0) and (5,0) again.

The "Determinant" (b2 -4ac)

Our two formula's for x1 and x2, suggests, that there are always two intersections with the x-axis.
That cannot be correct. Please see figure 3 again.

Remember, this is always true:

-A parabola in the form "y=ax2 + bx + c" can only have 0, or 1, or 2, intersections with the x-axis.
-A parabola in the form "y=ax2 + bx + c" can only have 1 intersection with the y-axis.

Implicit, in using the 2 formula's for x1 and x2, it is supposed that you examine the
(b2 -4ac) term, in the process of calculation.

It turns out that:

-If (b2 -4ac) is greater than 0, then there exists 2 intersections with the x-axis.
-If (b2 -4ac) is 0, then there exists just 1 intersection with the x-axis.
-If (b2 -4ac) is smaller than 0 (thus negative), then there exists no intersections with the x-axis.

Sometimes, the expression (b2 -4ac) is called the "Determinant", since it "determines"
how many intersections with x-axis exists.

5. Intersection(s) of a line with a parabola.

Just imagine some parabola, and some line. That line may cross the graph of the parabola
at two points, or just one, or maybe not at all. It just depends on the slope of that line, for example.

How can we find the coordinates of the intersections?

Suppose the parabola is denoted by f(x).
Suppose the line is denoted by g(x).

If they intersect, then at those two points (or just that one point), f(x) must be equal to g(x).

Let's try an example:

Suppose we have:

f(x)=2x2 -3x + 2
g(x)=3x + 2

Find the point(s) where they intersect (if any, ofcourse).

In order to find the "y" values, we do this:
At the intersections, f(x) must be equal to g(x), so we must have:

2x2 -3x + 2 = 3x + 2

We are going to solve that equation. Bring "3x" to the left, and "2" to the left:

2x2 - 6x = 0 =>

x2 - 3x = 0 =>

x(x-3) = 0 =>

x=0 and x=3   (in math we actually should say x=0 OR x=3).

So, we have found the two x values of the intersections. We can next use one of both equations
to find the corresponding y values:

For x=0, then we have y=2.
For x=3, then we have y=11.

Thus the points where the line and the parabola intersect, are (0,2) and (3,11).

6. Linear and Quadratic Inequalities.

You might see for example the inequalities:

-2x+3 > 3x-4

-x2+8x < 2x2 -10x

Let's take the second example above. Suppose f1 = -x2+8x and f1 = 2x2 -10x

If you see such an inequality as "-x2+8x < 2x2 -10x", then you might "interpret" it as:

f1 < f2: that is: where is graph of f1 below the graph of f2?

Figure 4. Inequalities: Where is the one graph, below or above, the other one?


If you look at the two pictures above:

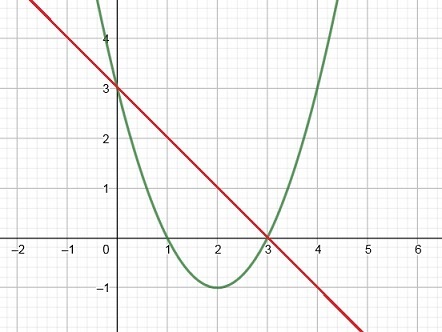
- then where is the parabola below the line? Meaning: for which "x" is the parabola below the line?
If you simply look at the first figure, then you will see that for x in the interval [0,4],
the parabola is below the line. Usually, it is notated as: "0 < x < 4".

- then where is the red line above the blue one? Meaning: for which "x" is the the red line above the blue one?
If you simply look at the second figure, then you will see that for "x > 3", the red line, is clearly above the blue line.

What seems to work, is finding the intersecting point(s) of both graphs, and from then
it is rather easy to determine the "x" interval for which the inequality is true.
Simply use any "test value" for x on the left or right, for the "x" you have found
of the intersection.

Let's see a few examples.

Example 1.

Suppose we have:

f(x) = x2 - 4x + 3
g(x) = -x + 3

See figure 5 below.

Figure 5. For what x, is f(x) < g(x)?


Now we need to solve: x2 - 4x + 3 < -x + 3
In other words: for which interval(s) of x, is the parabola below that line?

Let's find the intersection(s) of the line with quadratic function.

Where they intersect, we must have f(x)=g(x).

x2 - 4x + 3 = -x + 3
=>
x2 - 3x = 0
=>
x(x-3)=0

Thus x=0 Or x=3.

These are the solutions for the "equation", which is f(x)=g(x).

Now, it's relatively easy "to see" from the graphs that for the interval

0 < x < 3, we indeed have that f(x) < g(x).

Example 2.

Suppose in Example 1, it was the other way around: That is: For what x, is f(x) > g(x)?

We already have found the two intersections. So we may conclude:

For x>3 and x<0, we have f(x) > g(x).

Example 3.

Again, let's stay with example 1.
We do not neccessarily have to study graphs.
Let's stay with pure algebra this time.

f(x) = x2 - 4x + 3
g(x) = -x + 3

For what x, is f(x) < g(x)?

x2 - 4x + 3 < -x + 3
=>
x2 - 3x < 0
=>
x(x-3) < 0

We have two factors here. We only can get a negative result (< 0), if only one of the factors is negative.
For example, if both terms are negative, the product would be positive (> 0).

That means:

x>0 AND x-3<0 => x>0 AND x<3 => which is more nicely notated as "0 < x < 3".

Yes, but why not "x<0 AND x-3>0" ???
Good question. It's because "x-3" must be smaller than "x" alone, so the set "x<0 AND x-3>0" is impossible.
This is why we only can have: "x>0 AND x<3" <=> which is more nicely notated as "0 < x < 3"
Only using algebra is fine, but then you need a tiny bit of additional reasoning....

A note on linear inequalities like "ax + b < or > cx + d":

You may see the left and right sides of the inequality symbol, as linear functions.

Suppose we have linear inequality:

2x - 6 > -3x + 4

Then you might say: where (for what x) is the line f(x)=2x - 6 above the line g(x)=-3x + 4?

-Ofcourse, you may first find the point of intersection of those lines. Suppose for
the intersection we have found "x=a". Next, we substitute some test values for x in the inequality,
for "x>a" or "xa" or "x We can also evaluate the graphs, to see if we need "x>a" or "x
So, let's find the intersection first:

2x - 6 = -3x + 4 => 5x = 10 => x=2.

If we fill in "x=2" in either of the equations, we find the corresponding "y".
Let's use the first one: "y=2x - 6". Then y=2*2-6=-2.

Thus, the lines intersect at the point (2,-2). However, we only need the "x" value,
we already have found before, namely "x=2". The question was: for which x values is
the line f(x)=2x-6, above the line g(x)=-3x + 4? So, finding the "y" value was not needed after all.

It's reasonable to use, say x=3 as a test value in f(x)=2x-6. This gives 2*3-6=0.
Now insert it in g(x)=-3x + 4. This gives -3*3 + 4 = -9 + 4= -7.
Thus for x=3, we have indeed that it is true that 2x - 6 > -3x + 4.

Thus the solution for "2x - 6 > -3x + 4" is "x>2".

So, the method above is not very complicated.

-But let's use algebra only:

For the example above, we have:

2x - 6 > -3x + 4
=>
5x > 10
=>
x > 2

You see that? Without any drawing of graphs, we immediately have found "x>2".

One thing to beware of: multiplying or dividing by a negative number:

When we have some sort of inequality, and during solving, we need to multiply or divide
both sides of "<" or ">", by a negative number, then:

"<" becomes ">".
">" becomes "<".

Example:

Suppose we have:

7x + 5 < 9x + 4

add -5 to both sides (or some say: bring 5 to the other side, and flip sign).

7x < 9x – 1

add -9x to both sides (or some say: bring 9x to the other side, and flip sign).

Now we are left with:

–2x < –1 => -x < -½

As usual, we like to have it in the for "x=", instead of "-x=".

Just think about it: for what "-x", would it be smaller than -½?
Suppose "x=1" (the plus 1), then would it be true? Fill it in: -1 < -½? True.

-x < -½

multiply both side with "-1", and flip the "<" to ">".

x > ½

Another example of solving inequalities.


Figure 6. The costs that three companies charge you for phone services.
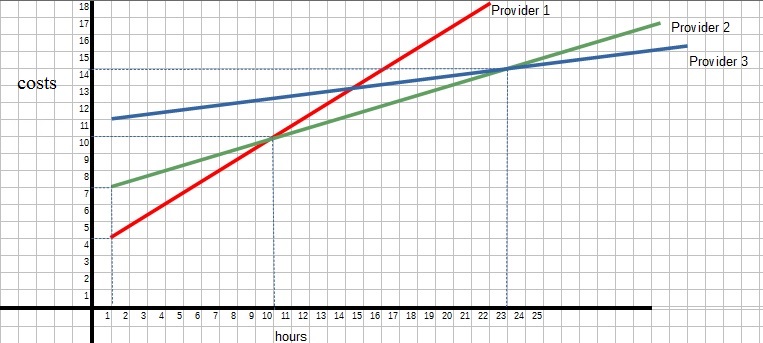


If you use a cell phone, the costs are dependent on how many hours you use your phone.
In the figure above, we see the graphs of "costs per hour" that 3 different providers
would charge you.

The y-axis represents the costs, and the x-axis represents the numbers of hours you
use you phone.

Question: which provider is the cheapest?

There is not "one" answer, because if you study the figure above, there are different x intervals
for which a certain provider would be the cheapest one.

Could you work this out, that is, finding the x intervals which identifies the cheapest provider?

The next two sections are optional reading. You may skip this, if you want to follow my series.

7. Quadratic functions and relations.

The equation "y=ax2 + bx + c" is also called a funcion because every "x" is mapped
to exactly one "y". This is just an "agreement" among mathematicians, established a long time ago.

You can take a look at the parabola we have shown sofar, and it's true. For each x on the x-axis, you find only 1 "y".

By the way, if you have equations like "y=ax+b", or "y=ax2 + bx + c", then those are quaranteed to fullfill
the "rule" that every "x" is mapped to exactly one "y" only.

You can see that very clearly with a line defined by "y=ax+b". There really is just one "y" for every specific "x".

In such cases, people also write y as y = f(x), where f(x) is for example "ax+b". The "f" then suggests,
that we are dealing with functions.

But not every relation between "x" and "y" is a function. Take a look at figure 4:

Figure 7. An example of a "circle" and "ellips".
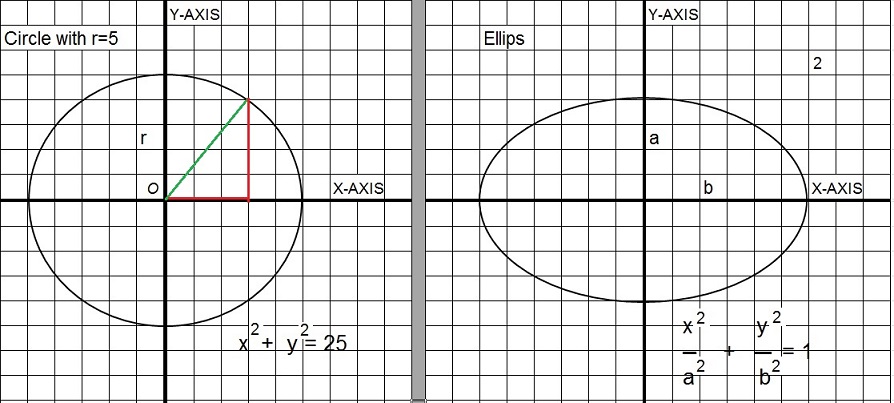


If you look at the circle, you will see that any "x", is mapped to 2 "y's".
For example, x=3 is mapped to y = 4 and y = -4.
For this reason, the circle is not described by a function, but by a "relation" between x en y.

For a circle centered around the "origin" (where x-axis and y-axis comes together), the relation is:

x2 + y2 = r2

Where "r" is the radius of the circle. Since a circle is fully symmetrical, if I prove the equation for a few
x's en y's, then you probably "believe" the equation is right.
Well, for example, take a look at the circle in figure 4. For that circle, the radius "r" is 5. So r2 = 25.

For the point (5,0) holds: 52 + 02= 25 + 0 = 52 = 25. This is true.
For the point (-5,0) holds: -52 + 02= 25 + 0 = 52 = 25. This is also true.
For the point (0,5) holds: 02 + 52= 0 + 25 = 52 = 25. This is also true.

Alright, these were special points. But now, for example for the point (3,4). Does the relation then holds too?
If you look closely, you will see that (3,4) sits on the circle, so this is true. Now, let's calculate:

32 + 42 = 9 + 16 = 25

Right again.

For points on a circle (centered around the origin), "x2 + y2 = r2" is always true.

Maybe you see the "connection" with the famous Pythagorean theorem.
Let's focus on the point (3,4) again. It's on the circle. In figure 4, you can see that the length of y = 4,
and the lenght of x = 3. You notice the right-angled triangle shown in figure 4?

For the point (3,4), the equation "x2 + y2 = r2" is simply the same as the Pythagorean theorem.

Actually, if you think about it, you can always create (or imagine) such a right-angled triangle for any point on the circle.

8. Higher order polynomials.

We have seen linear equations, and quadratic equations up to now. The are of the form:

y=ax+b
y=ax2 + bx + c

But, ofcourse, higer powers of "x" are possible too. Let's see a simple function of "x" to the power of three.
We also often hear that the "degree is three".

y=ax3

Or, in a general format:

y=ax3 + bx2 + cx + d

Sometimes, equations of a certain degree, are also called "polynomials" of that degree (like 3).

Usually, in basic math, these sorts of equations are "left alone", like in the sense of finding
intersections with the x- and y-axis.
So I won't tought them here either. But I like you to know about them.

By the way, the point where such higher-degree function crosses the y-axis, is very simple to calculate.
Because, at that point, neccessarily (as always) x just has to be 0.

So: for the intersection with the y-axis:

y=ax3 + bx2 + cx + d, and if x=0, it means: y=a03 + b02 + c0 + d = d.
So the point where the curve hits the y-axis is (0,d).

Since y varies mainly with ax3, usually, the function "climbs or sinks" really fast.
For example, if we look at the simplest one, namely "y=x3", then when x=6, y already is 216.

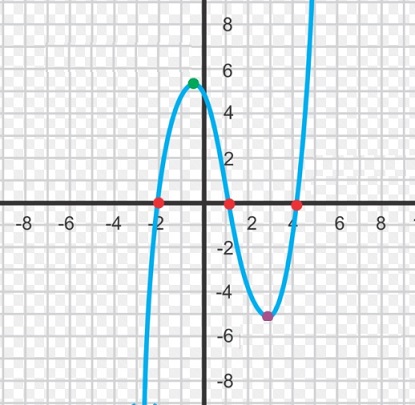
You might like to Google on the shape of polynomials of the 3rd degree. They often have one "top" (maxima),
and one "crest" (minimum), and tend to rise or sink steeply with larger (positive or negative) "x".

But depending on the values of the coefficients (a, b etc..) their shapes can vary enormously.
(Some polynomials of the 3rd degree, with specific coefficients, do not have a distinguished maxima or minima).

Figure 8. An example of a polynomial of the 3rd degree.


Optional reading (you absolutely don't have to):

You don't need to memorize the following.
Indeed, the following might look pretty awkward at first sight. But really, it not so difficult at al.

We might thus also have "n" th degree polyniomials

For example, in a very general form:

y=anxn + an-1xn-1 + ... + a1x + c

So, we might have one of the fourth degree:

y=a4x4 + a3x3 + a2x2 + a1x1 + c

Note that the usual coefficients like a,b, and c, are replaced by numbers designated as an, an-1 etc..
That's it ! Hope you liked it.

The next note is a super quick intro in sinus and cosinus functions.